Data analytics website and product design
Data and analytics design that makes dense data easy to read
Brand, website and product UI for BI, analytics and data platforms. We make complex data readable, for the data team and for the business buyer.
- $11M Series A raised by Lightdash
- $12.5M Datawizz seed
Teams we’ve worked with
DesignMe is a design agency for data and analytics companies. We design brands, websites and product UI for BI, analytics and data infrastructure startups that sell to a data team and to business users at once. Clients include Lightdash, Datawizz, Quadratic and OpenSincera. We refreshed Lightdash’s brand, website and product UI in a partnership of 16+ months, and launched its new website in 8 weeks.
- Data and analytics clients
- Lightdash, Datawizz, Quadratic, OpenSincera
- Raised by these teams
- $39M across Lightdash, Datawizz, Quadratic and OpenSincera
- Fastest launch
- Lightdash: new website live in 8 weeks
- What we design
- Brand, website, product UI, investor materials, motion
Fit
Who we work best with in data, analytics and BI
A good fit if
Probably not a fit if
- Not a fit: Teams that need data engineering, pipelines or dbt models built
- Not a fit: Companies that want internal reports built in Looker, Tableau or Power BI
- Not a fit: Pre-funding ideas that need a prototype for under a few thousand dollars
Sound familiar?
Your data team gets it. The rest of the company has to get it too.
Data products sell to two audiences at once: the analysts who adopt the tool and the business that pays for it. If a few of these sound like you, this page is for you.
Your homepage reads like a list of connectors and SQL features.
Analysts follow it; the person who signs does not. We lead with the question your product answers, then give the technical reader the stack and integrations.
Your product screenshots are dashboards nobody can read at website size.
We redesign product moments for the site: one chart, one question, one answer, with motion where it helps.
You are open source, and visitors cannot tell what the paid product adds.
We make the line between the free project and the cloud or enterprise product clear, with pricing and a path that turns users into customers.
Your dashboards look powerful, and new users do not know where to start.
We design product UI with a clear hierarchy, sensible defaults and real empty, loading and error states, so a business user finds the answer without an analyst beside them.
Buyers ask where their data goes before they ask what the product does.
Warehouse access, permissions, self-hosting and where queries run. We put those answers on the site in plain words.
You raised the round, and the site, deck and product no longer look like one company.
We design them together. For Lightdash that meant brand, website and product UI; for Datawizz, brand, investor materials and the website.
By stage
What data companies need from seed to Series A and beyond
Seed
Look credible to investors and the first data teams: a brand, a clear story and a site that shows what the product does with real data.
What we usually deliver
- Brand identity
- Pitch deck and investor materials
- Launch website
- Launch videos and motion
- Product screens for the site
Clients at this stage
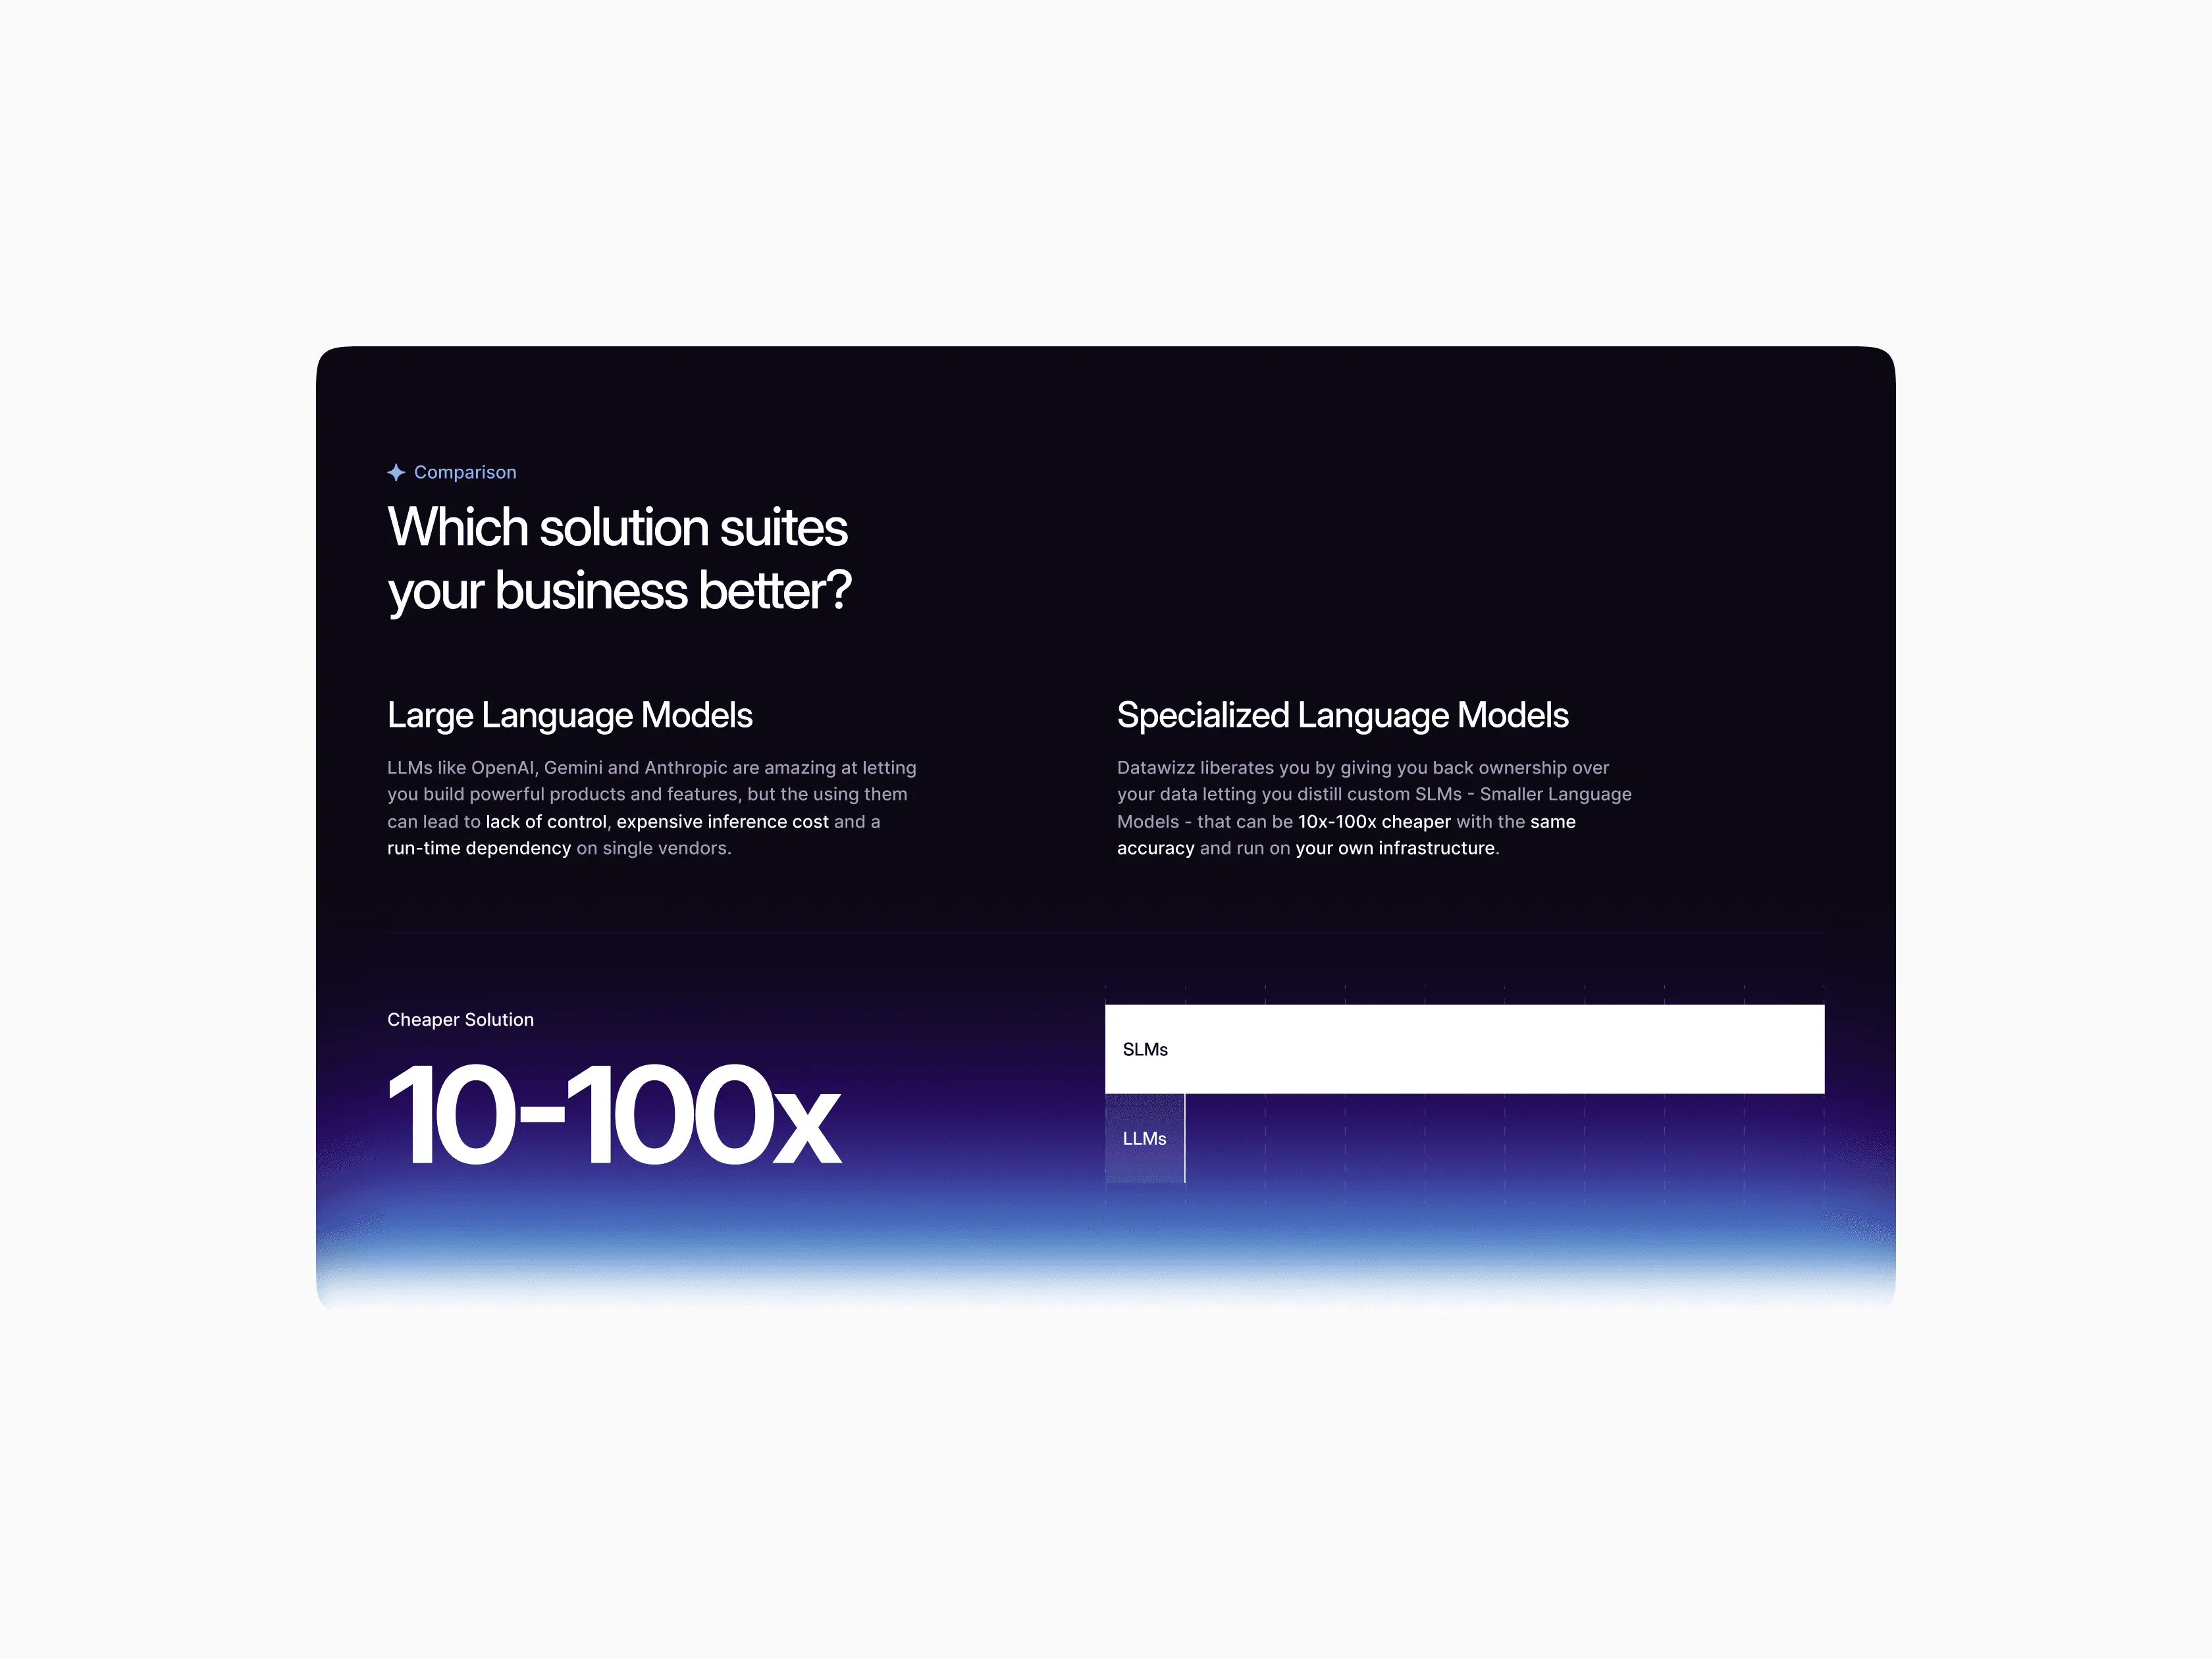
DatawizzSeed
Brand, investor materials, launch videos and a Framer website for a data platform, over an 18+ month partnership.
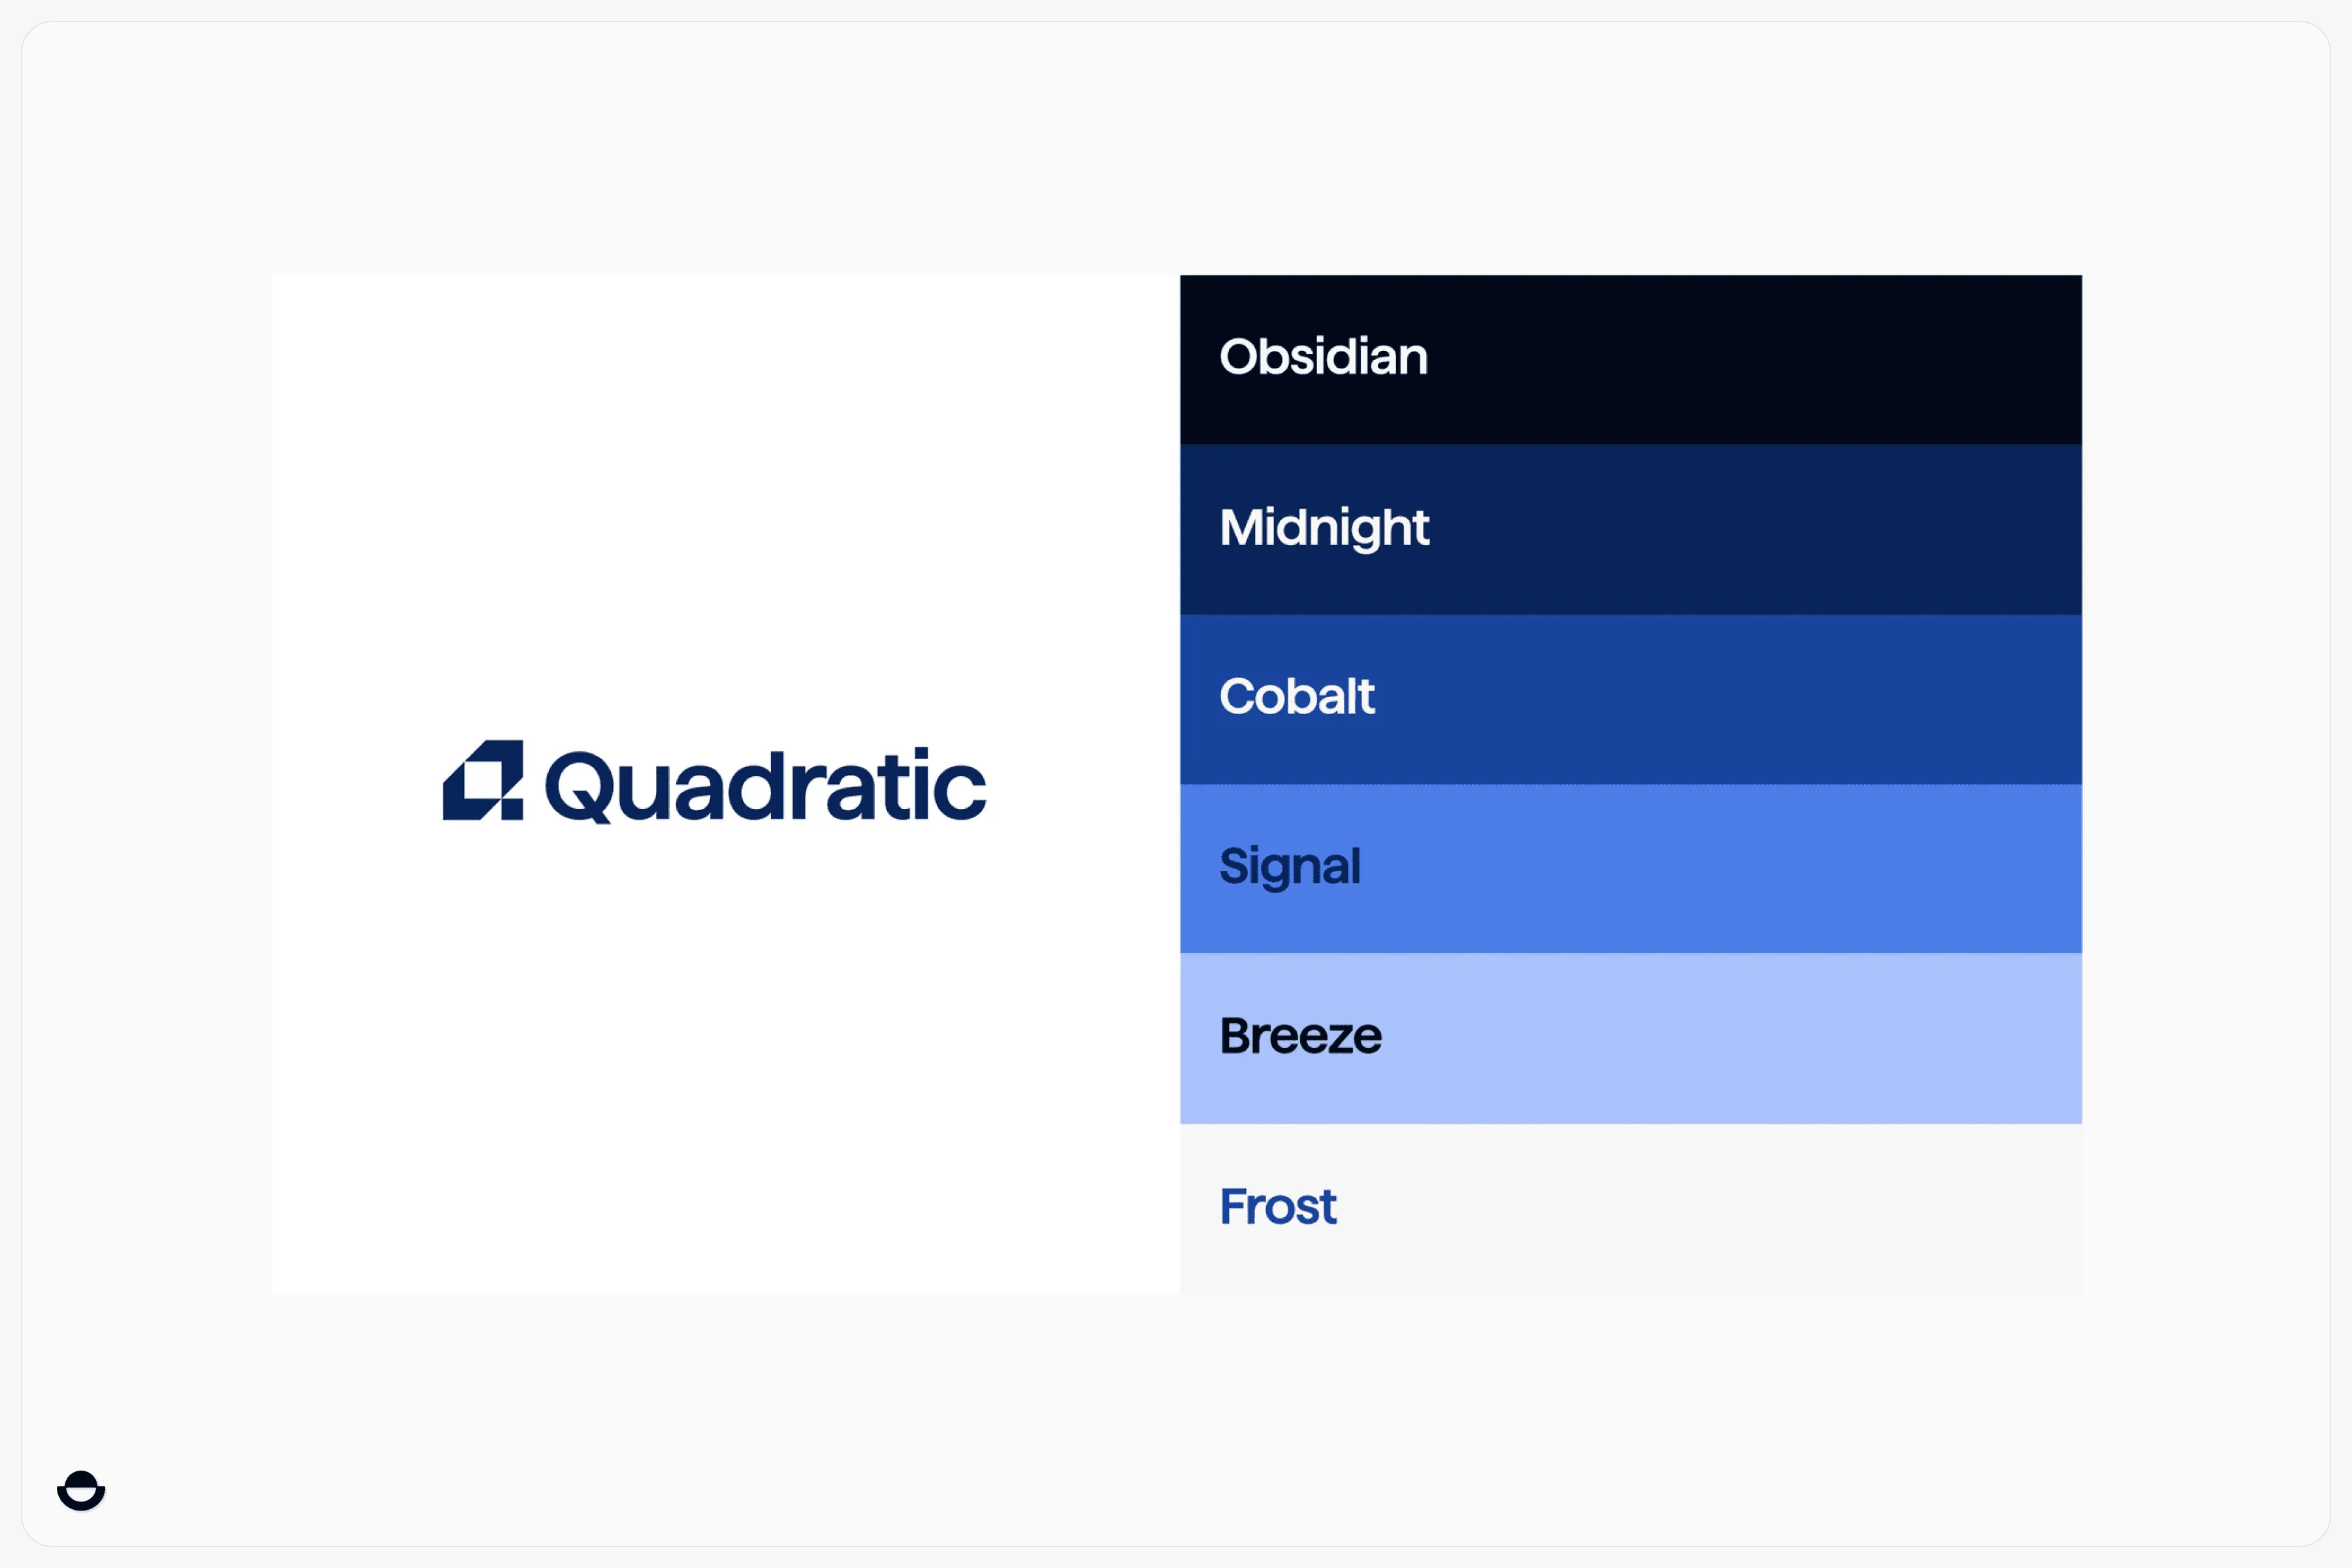
QuadraticSeed
Brand identity and assets for a spreadsheet built for data teams.
Series A
Turn adoption into revenue: separate paths for the data team and the business buyer, a clear free-to-paid line and product UI that matches the site.
What we usually deliver
- Brand refresh
- Website redesign
- Product UI and design system
- Pricing and cloud product pages
- Explainer motion
Clients at this stage
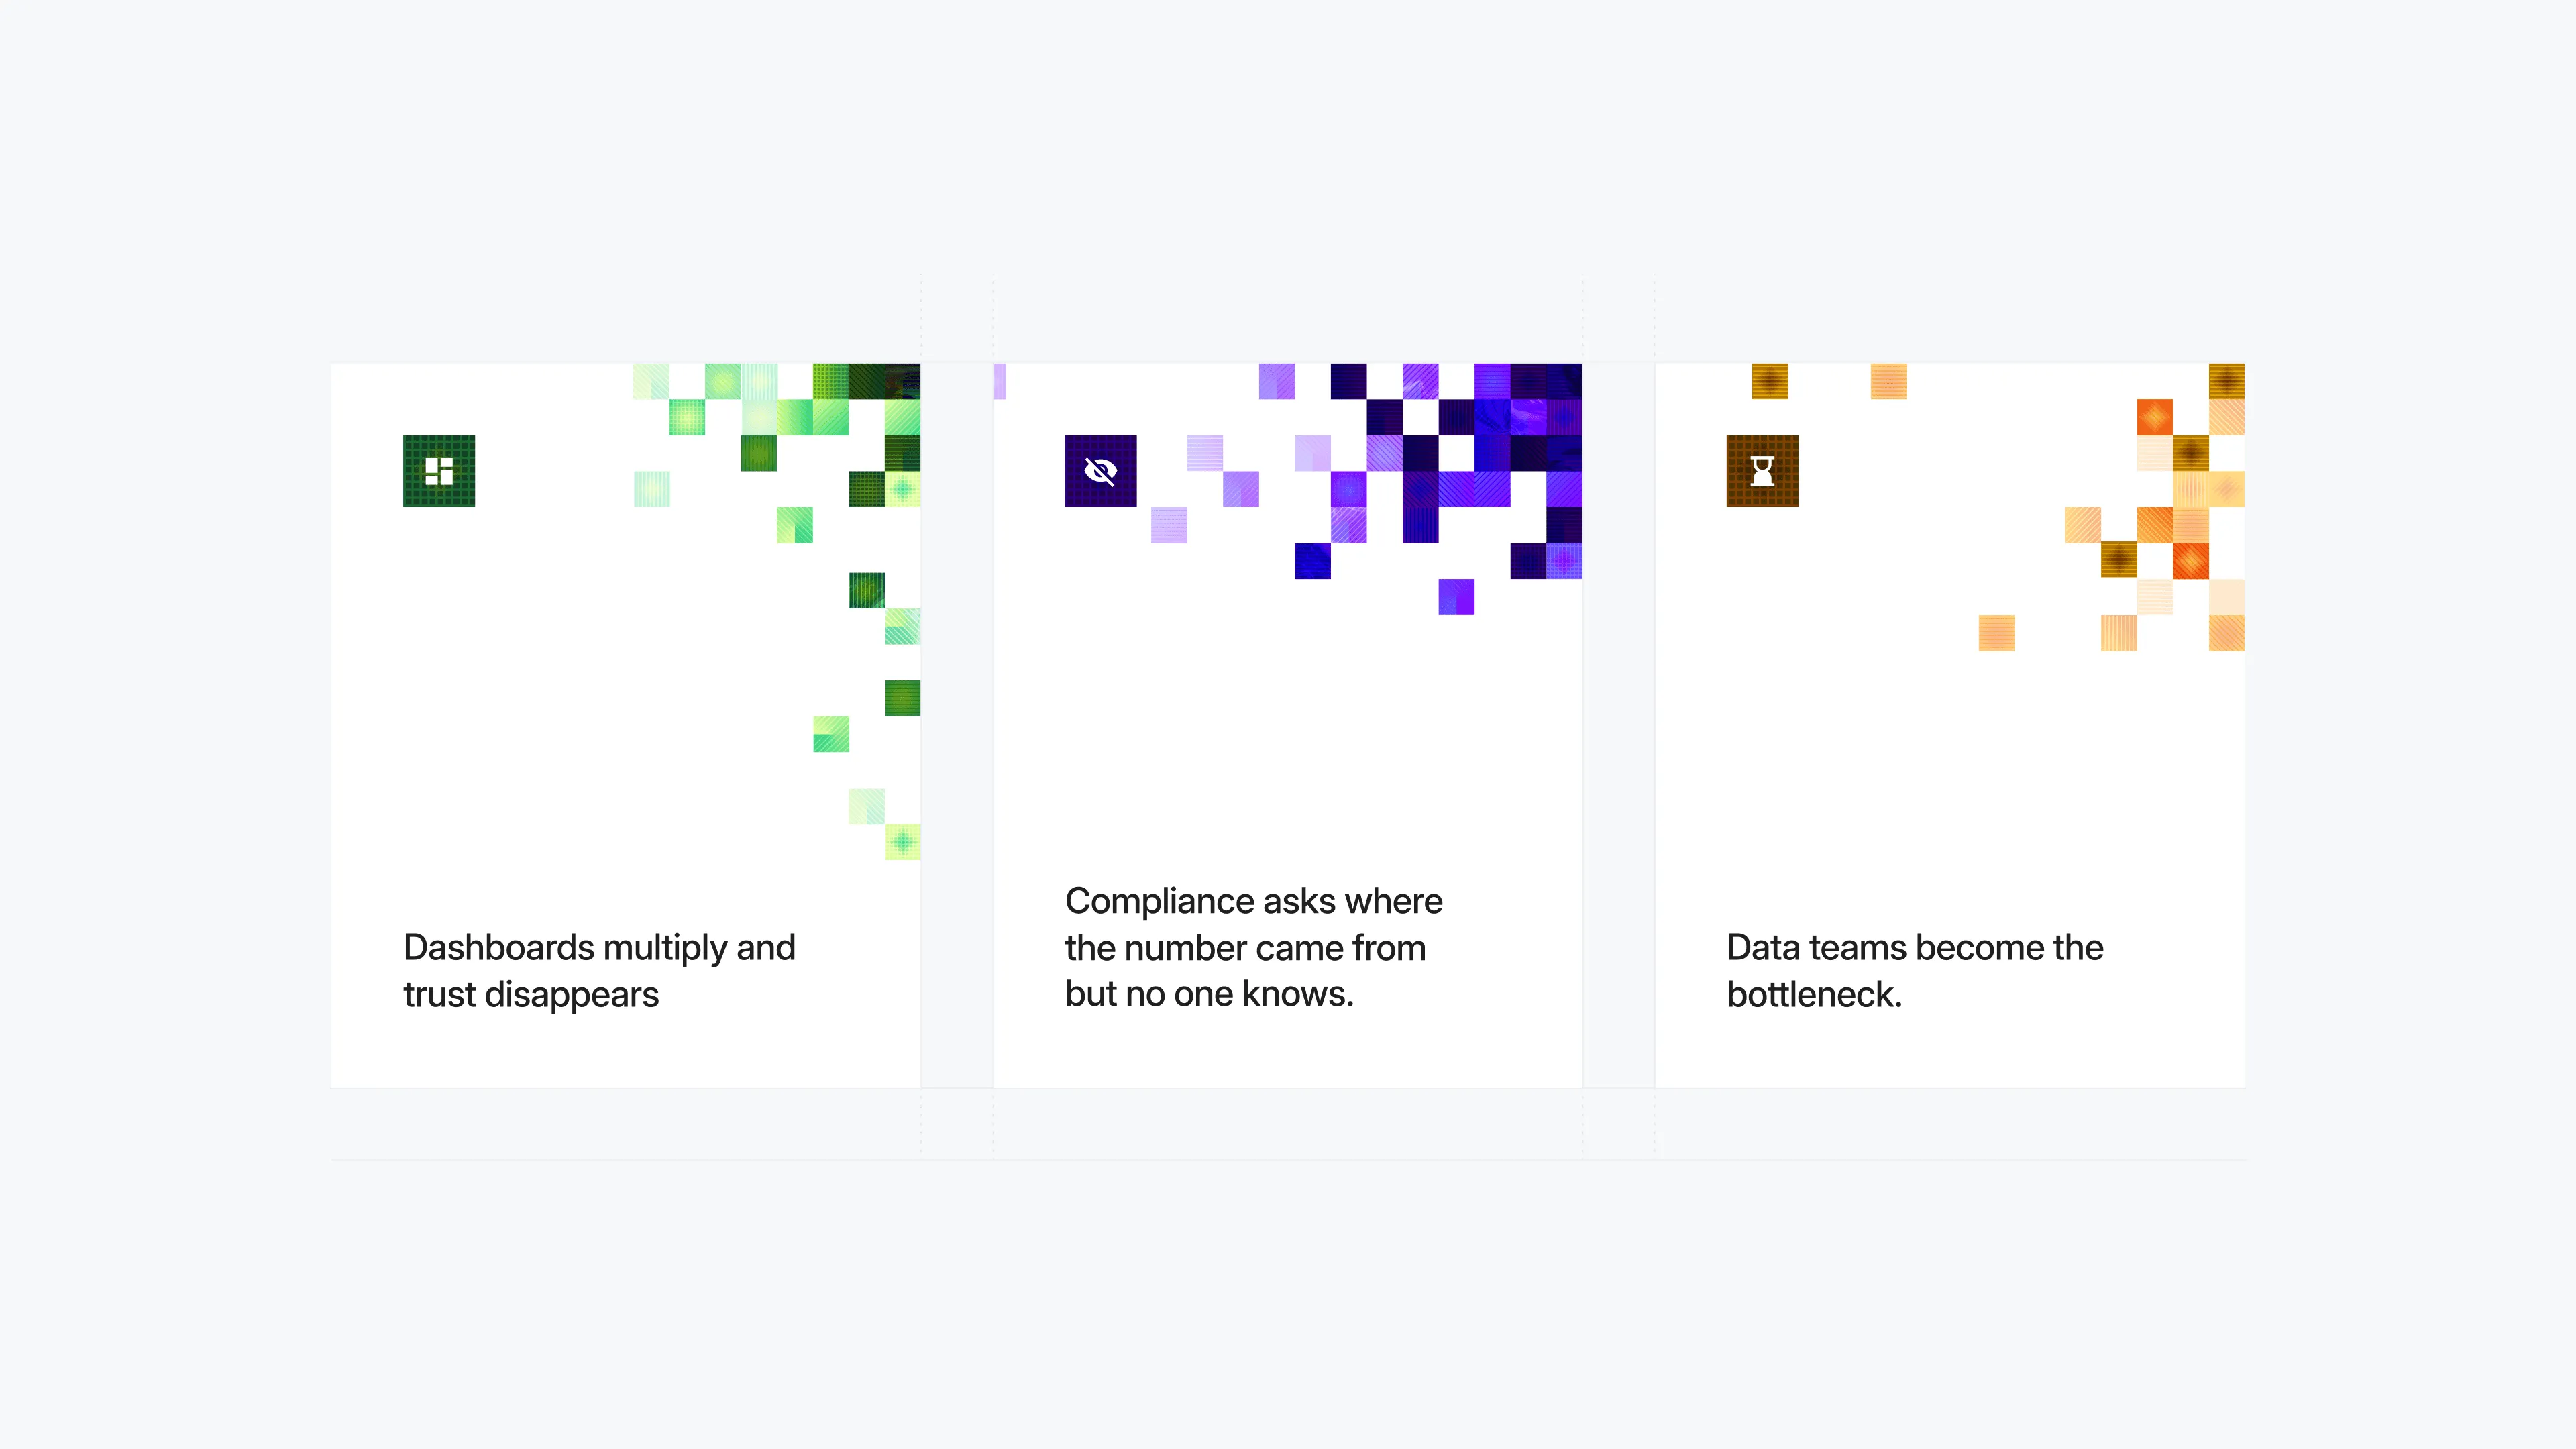
LightdashSeries A
Brand, website and product UI refresh for the open-source BI platform; the new website launched in 8 weeks.
Growth
Sell to larger companies: security and governance answers, use case pages by team, and a product that stays readable as features pile up.
What we usually deliver
- Enterprise and security pages
- Use case and role pages
- Design system for product and site
- Ongoing design subscription
Quick check
Can a business user understand your product in ten seconds?
Tick what is true today.
What each score means
- 0 to 3Read only by data people Analysts may get it, but buyers probably cannot tell what the product does for them. Start with the headline, one readable product moment and a path for the business. Book a data site review
- 4 to 6Clear to analysts, not yet to buyers The basics are there. A clearer free-to-paid line, data access answers and a more readable product usually come next. Talk through the gaps
- 7 to 8Ready for the whole business You speak to both audiences well. Next gains come from use case pages, enterprise answers and product polish. Plan the next step
By the numbers
Proof from data teams that sell to the whole business
$11M
Series A raised by Lightdash, the open-source BI platform, led by Accel. We refreshed its brand, website and product UI.
$12.5M
seed round raised by Datawizz, led by Human Capital. We designed its brand, investor materials and website.
8 weeks
to launch Lightdash’s new website, inside a design partnership that has run for 16+ months.
99/100
speed score on Google PageSpeed Insights for the Datawizz Framer website.
Sources
- TechCrunch: Open-source BI platform Lightdash gets Accel’s backing (October 2024) (opens in a new tab)techcrunch.com
- Datawizz: $12.5M seed round (September 2025) (opens in a new tab)vcaonline.com
Press Escape to close.
Facts and figures checked on .
Glossary: 6 terms, in one sentence each
Business intelligence (BI)
Software that turns company data into dashboards, reports and answers people use to make decisions.
Semantic layer
A shared set of metric and dimension definitions, so "revenue" means the same thing in every chart.
dbt
An open-source tool data teams use to transform data inside the warehouse with version-controlled SQL models.
Data warehouse
A central database built for analytics, such as Snowflake, BigQuery or Redshift.
Self-serve analytics
Analytics business users can explore on their own, without asking a data analyst for every question.
Open core
A model where the core product is open source and a paid cloud or enterprise edition adds hosting, security or scale.
How we help
Services that matter most for data and analytics companies
Website design
A site that shows a readable product moment, gives data teams and business buyers their own paths and explains what the paid product adds.
Product design
Dashboards, charts, query flows and onboarding with a clear hierarchy, so power users move fast and business users still find the answer.
Brand identity
A brand that stays recognizable next to bigger data tools, instead of more blue gradients and abstract nodes.
Motion design
Short loops that show a question turning into a chart in seconds, on the site, in launch videos and in the deck.
Pitch deck design
Investor materials designed with the brand and website, so the product, the data story and the company look like one.
Talk to us about your data and analytics project
We’ll help you map the right scope, team, timeline, and next steps.

FAQs
Questions about data and analytics design, answered

Do you design websites for data and analytics companies?
Yes. We refreshed the brand, website and product UI for Lightdash, the open-source BI platform, and designed the brand, investor materials and website for Datawizz. We designed Quadratic’s brand identity and OpenSincera’s brand and website.
How should a BI or analytics website speak to data teams and business users?
On separate paths from the first screen. Analysts and engineers usually find the tool and test it; a head of data, finance or operations signs off.
Lead with the question the product answers, show it working with a readable chart, and give the technical reader integrations, docs and data access details one click away.
How do you make dense dashboards easy to read?
Start from the question each view answers, then cut what does not help answer it. Clear hierarchy, consistent chart types, sensible defaults and labels in plain words do most of the work.
Empty, loading and error states matter as much as the full dashboard, because that is where new users decide whether to trust the numbers.
How should an open-source data tool show what the paid product adds?
Name the free project and the paid product plainly, then show the difference: hosting, security, collaboration, support or scale. A comparison table and a pricing page that explains the units help more than another feature list.
The community should feel welcome, and still see a reason to become customers.
How long does a data analytics website take?
A focused website usually takes four to ten weeks; Lightdash’s new website went live in 8 weeks.
A brand identity, website and product screens together take longer, depending on the number of pages and product views involved.
How much does a data analytics website cost?
Freelancers and templates can cost a few thousand dollars, while a boutique agency usually charges $8,000 to $25,000 for a full website. Brand, product UI and motion work add to that.
Our SaaS website design cost guide explains what moves the price.
Can you design our product UI and dashboards, not just the website?
Yes. We design dashboards, charts, onboarding and settings so they match the brand and the website. For Lightdash we refreshed the brand, website and product UI together, in a partnership that has run for 16+ months.
You've reached the end, so now…
Tell us what you’re building.
We’ll help you map the right scope, team, timeline, and next steps.
Book a call